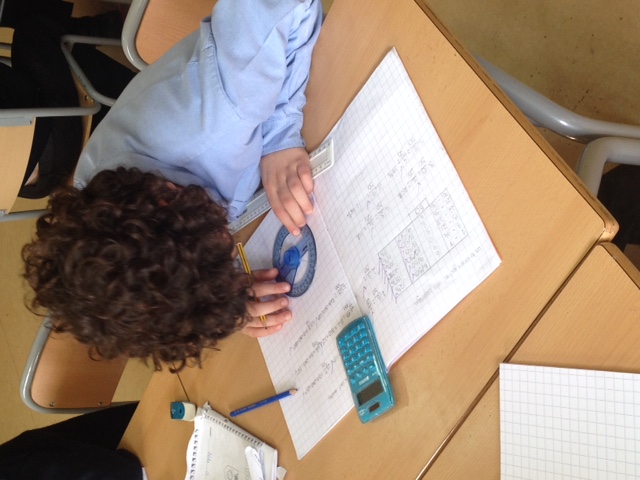
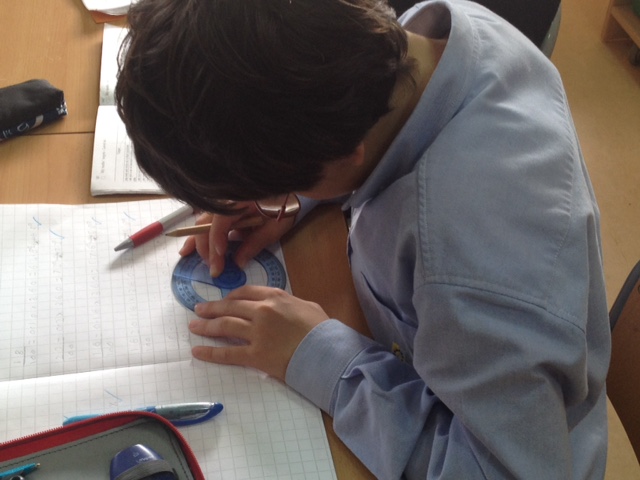
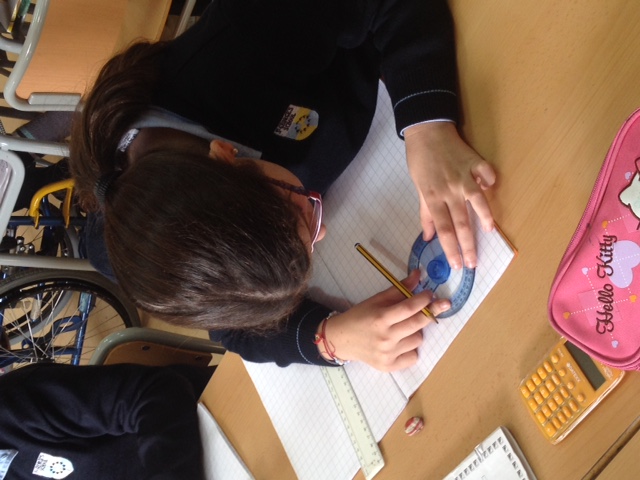
This week, my maths group have been making data and creating graphs. We begun by making a grouped data tally chart. Afterwards we made a frequency bar chart. Finally we converted the information into percentages and then displayed the information as a pie chart. To do that, we needed to convert the percentage into a decimal and then multiply by 360 to work out how many degrees each section was.
Pupil ZoneUse the buttons below to go to our school subscription websites Other St George's Seville blogsOther St George's school blogsArchives
June 2015
Categories |
 RSS Feed
